Sunday, October 1, 2023

Comparing S&P 500 And Berkshire Hathaway

One of the reasons why I had recommended S&P 500 and Berkshire Hathaway (Berkshire) was that both were representative of the United States (U.S.) market, so in my opinion they are good choices for newbies to enter it.

The other reason for their inclusion, something which I did not highlight much about,

was their relative performance with each other; a comparison between the two as stated in the latest Berkshire letter to shareholders, over a 58-year period from 1965 to 2022, Berkshire returned compounded annual gain of 19.8%, as compared to S&P 500’s 9.9%1. A USD 100 investment into Berkshire in 1965 will return around USD 2.42 million as at the beginning of 2023 versus S&P 500's roughly USD 22,4002.


A Relook


For a more recent analysis, using Portfolio Visualizer, I had pulled out an in-depth view of the two counters. Available data for Berkshire Hathaway Class A share between Jan 1986 and Dec 2022 (Class A was chosen as it had a longer history than Class B, which was issued in 1996) was compared with the Vanguard 500 Index Fund Investor, acting as a proxy for the S&P 500.


During this period, Berkshire's compounded annual growth rate stood at 15.23% against S&P 500's 10.42% (see Figure 1). Looking at rolling returns, which is of interest to long term investors, the average 10-year and 15-year for Berkshire stood at 14.30% and 12.87% respectively, with S8P 500's average 10-year and 15-year at 9.93% and 8.54% respectively (see Figure 2).


Fig.1: Returns and other data between Berkshire Hathaway and Vanguard 500 Index Investor, Jan 1986 to Dec 2022. Source: Portfolio Visualizer. Click to view larger.


Fig.2: Rolling returns between Berkshire Hathaway and Vanguard 500 Index Investor, Jan 1986 to Dec 2022. Source: Portfolio Visualizer. Click to view larger.


Why The Difference?


Berkshire is currently helmed by two of the greatest investors known by many: Warren Buffett and Charlie Munger. Part of their successes can be attributed to their value investing methodology (discounted cash flow and intrinsic value), looking for great companies (having a wide "moat") and having the virtue of patience ("be fearful when others are greedy..."), to name a few.


Investing in Berkshire is like investing in an actively managed fund, just that you need not pay the high fees that are associated with it. Being a "fund", Berkshire has the discretion to buy and sell companies within its portfolio as it deems fit.


This is unlike the S&P 500 in which the investment vehicles following it (e.g., exchange traded funds, unit trusts, etc.) must at least replicate most of the holdings of the index itself, thus there is no freedom of selection.


Another overlooked aspect of Berkshire is it holds both public and private companies. You may have heard about it having close to 50% of holdings in Apple, but that does not mean 50% of Berkshire's invested funds are in Apple. Notable private companies under Berkshire's belt included See's Candies, Duracell and insurance companies GEICO and Gen Re. These private companies would have contributed further to Berkshire's returns. Also, it is from its insurance arm that Berkshire can garner the cash power to purchase equities using insurance float (difference between premiums and claims paid out).


Why Still Need S&P 500?


Despite the superiority of Berkshire's past performance over S&P 500, the latter is still included in a U.S. market beginner's toolbox. The reason is obvious: diversification.


Both Berkshire and S&P 500 represented different microcosms of the U.S. market and economy in general, and having them would be the closest thing in getting one's fingers dipped into the whole U.S. market and economic pie.


Furthermore, the management and investment decisions of Berkshire would have to be handed over to the next generation after Buffett and Munger, which there may be some deviations in investment methodology and decision-making process. The term “past performance does not indicate future results” is to be reminded of.


Contrasting to S&P 500, as an index, the inclusion of companies followed a set of requirements, which included market capitalisation, profitability and liquidity. This captures the essence of the microcosm analogy described above as the S&P 500 showed the current sectoral and industrial trend of the U.S.


And to conclude this post with a fact: S&P 500 contains Berkshire, too, and it is among the top 10 constituents by index weight3.


Disclosure


The Bedokian is vested in Apple, Berkshire Hathaway and S&P 500 via the SPY ETF.


Disclaimer


1 – Berkshire Hathaway Inc. Shareholder Letter 2022, p2. https://www.berkshirehathaway.com/letters/2022ltr.pdf (accessed 30 Sep 2023)


2 – Berkowitz, Bram. If You Have Invested $100 in Berkshire Hathaway in 1965, This Is How Much You Would Have Today. The Motley Fool. 3 Jan 2023. https://www.fool.com/investing/2023/01/03/if-invested-100-berkshire-hathaway-1965-how-much/ (accessed 30 Sep 2023)


3 – Equity S&P 500. S&P Dow Jones Indices. 31 Aug 2023. https://www.spglobal.com/spdji/en/idsenhancedfactsheet/file.pdf?calcFrequency=M&force_download=true&hostIdentifier=48190c8c-42c4-46af-8d1a-0cd5db894797&indexId=340 (accessed 30 Sep 2023)


Saturday, September 23, 2023

In For The Long Haul

The United States (U.S.) Federal Reserve had signalled a few days ago that there would be one more interest rate hike before the year ends, and that the rates would be held steady for a longer time.

The latter point above would have severe downstream repercussions for the markets and economies. Optimistic predictions and estimates of a drop in interest rates in at least the first half of 2024 had evaporated, and with such high numbers, leverage itself had turned to the other edge of the sword and cut into companies and organisations so used to having cheap loans.


This meant companies and real estate investment trusts (REITs) with high gearing, lower fixed rate loans, shorter debt maturity profiles and/or poor cash flow would be in for a ride in trying to navigate these high-rates waters. This is why in your fundamental analysis, it is important to select healthy companies and REITs for your portfolio.


On the other hand, cash and short-term treasuries are experiencing high yields. With Singapore’s interest rates somewhat correlated with the U.S. side, the past year or so had seen the popularity of erstwhile boring treasury bills (T-Bills), Singapore Savings Bonds (SSBs) and banks’ fixed deposits.


We are entering into relatively new stage of our investing life. Never had we seen a sharp rise of inflation and interest rates within a short time, and the last time this happened was in the last century’s 70s and 80s. For those whose investment portfolios were formed after the 2008/2009 financial crisis, like myself, this is unexplored territory. Yet, if your investment journey is a quarter/third/half way, you still have a long runway ahead of you, and definitely it will be full of events, good and bad.


However, if you do the following two things, your investment journey would be less daunting and you are better prepared for the things to come. 


The first is to stay diversified; it has been demonstrated in the past that different asset classes have different correlations with one another in different market and economic situations. Coupled with the act of rebalancing, your investment portfolio could at least withstand the storms with lesser detriment while enjoying some fruits during fine weather.


The second is to remain calm in good times and bad. Do not get overhyped when every day is a Sunday and gloomy when every day is a Monday. Follow through your tested investment philosophy and style methodically, which in this way the element of emotion is reduced.


Remember, we are in for the long haul, so keep calm and stay invested.


Monday, September 18, 2023

Of Custodians And Ringfencing

Occasionally there will always be a question popping up on the safety of having one’s securities in a custodian account. Time and again, some people will have the impression that if the brokerage who is holding their shares in custody goes under, there goes the shares. And I am quite surprised that due to this, a few investors would rather invest locally and have their shares custodised with the Central Depository, or CDP, which to me is a missed opportunity on diversifying into other markets outside of Singapore.

This thinking is not without basis. In 2011, a now-defunct U.S. based commodities brokerage firm MF Global had misused customers’ funds by using them to cover their liquidity shortfalls, and there were Singapore customers included. It was till 2016 that MF Global’s liquidators returned all the funds to the affected customers. Due to this experience, I have heard of at least one ex-MF Global client swearing off custodian accounts.


By legal right, the assets of investors are separated from the assets of the brokerage with whom the investors invest with. This is the “ringfencing” described in the title. In the rare event where the creditors are acting against the brokerage, they are going after its assets, not the investors’.


As the adage goes, however, anything can happen, and skeptics will argue the scenario of another “MF Global happening” and if so whatever safeguards and legal protections would be thrown into the wind. I do not dispute of such possibilities manifesting, since I acknowledge that there are many risks involved in investing, though in terms of probability, it is very rare.


Rather than restrict oneself from investing in overseas markets (or local markets if wanting cheaper transaction costs), why not diversify across different custodian brokerages? Recent years had seen several discount brokerages popping up, and adding a layer of safety and security is that they are (mostly, if not all) licenced by the Monetary Authority of Singapore. Perhaps these may convince those to try out (or retry) custodian brokerages, and from there, invest in the rest of the world?


References


Ross, Marc L. What Happened At MF Global? Investopedia. 17 Jan 2023. https://www.investopedia.com/financial-edge/0312/what-happened-at-mf-global.aspx (accessed 17 Sep 2023)


Saturday, September 16, 2023

Portfolio Pivoting

We had made a major pivoting decision with regards to our Bedokian Portfolio. It was not an overnight decision and sudden course of action. The transformation had taken place for the past six to nine months.

Okay, so what is the pivot all about?


For our Bedokian Portfolio built with our disposable income, we had followed the balanced allocation since its inception, which was 35% equities, 35% REITs, 20% bonds, 5% commodities and 5% cash.


Then what is our new allocation?


That would (currently) be 40% equities, 35% REITs, 15% bonds, 5% commodities and 5% cash. Basically, we had reduced the bond component by 5% and added it to the equities part.


I could call this “balanced-plus” Bedokian Portfolio, or “aggressive-minus” (for information, the aggressive Bedokian Portfolio make-up is 40% equities, 40% REITs, 10% bonds, 5% commodities and 5% cash)1, because it sits right in between balanced and aggressive.


Okay, it is just a shift of 5% from bonds to equities.


But that is not all. To “complicate” things a bit (and not advisable for passive investors), the combined equities-REITs would stand at 75%, with either component not going above 60% of the 75%, or below 40% of the 75%. In other words, we are “free-floating” the two asset classes between 60/40 and 40/60.


The next thing popping up in your mind would probably be “why the pivot?”.


After a few lengthy discussions with my other half, we had settled (somewhat) at an age where we would “step-down”. Contrary to “retire early”, step-down would be when we intend to leave the rat race and settle for a job with lesser responsibility (and lesser pay) and/or a more freelance role (and lesser pay). Several major factors contributed to the age number, and that includes our children’s age of entry to the workforce, the maturing amounts of our savings plans, the CPF amounts that we (might) take out to augment the Bedokian Portfolio, etc.


With our current runway, we decided to accelerate things a bit by going slightly aggressive not just on our Bedokian Portfolio, but on our investments via CPF and SRS, too. The key word is “slightly”; we are not going full retard into 100% equities. Diversification is still key in our overall approach.


1 – The Bedokian Portfolio (2nd Ed) p75


Sunday, August 20, 2023

REITs Winter (Again), So What Am I Looking At?

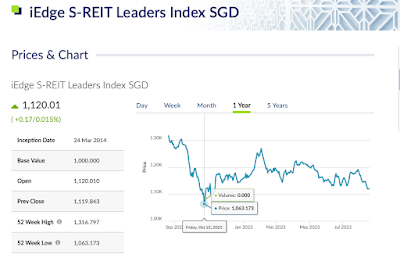
The Singapore REITs (S-REITs) seems to be heading for a winter. I had written a piece “Are REITs Doomed?” here back on 23 October 2022. Coincidentally, based on the iEdge S-REIT Leaders Index1, it had bottomed out just two days before the above post was published, before starting its recovery to the next one-year high at around early February 2023 (see Figure 1). Now, looking at Figure 1, you could see that the index is heading downwards again, sparking an early winter in 2023.


Fig. 1: iEdge S-REIT Leaders Index SGD, 1 year chart (as of 20 Aug 2023)


For myself, these down periods constituted a sales period when you could get counters at a discount. However, due to the economic situation of high interest rates, and properties are not doing well in most countries, we need to be selective on getting good, discounted REITs.


The following are what I am looking at. Do note that we have these counters in our portfolio and we are looking at averaging up/down on these counters.


REIT #1: Frasers Centrepoint Trust


Frasers Centrepoint Trust (FCT) has in its portfolio 9 suburban malls concentrated in the northern, northeastern and eastern part of Singapore, where there are a good proportion of residential towns (Hougang, Tampines, Punggol, etc.). We had seen the resiliency of suburban malls as gathering points for residents, and during the COVID-19 pandemic restrictions.


Though the gearing as of May 20232 stood at 39.6%, 76.4% of the debt was hedged to fixed interest rate, and that meant there is a higher stability of interest payments. Net property income had seen a 5.7% rise year-on-year between 1H2023 and 1H2022, and at its current price of SGD 2.19 as of 20 Aug 2023 represented 0.94% of its net asset value (NAV) of SGD 2.333.


As FCT is currently close to 11% of our portfolio holdings, we would still add but not many of this counter.


REIT #2: Paragon REIT


Singapore properties made up about 80% of Paragon REIT by valuation, and the crown jewel is the Paragon located in the heart of Orchard Road, which is both a luxury shopping mall and a hub of medical offices. With the return of tourism and increasing number of family offices with affluent clients, I foresee Paragon would be one of the important stops for these groups. In addition, suburban Clementi Mall’s location next to a MRT station and its near-monopolistic catchment area is attractive.


Having a gearing of 29.8%, it is one of the lowest geared S-REIT around, and 85% of the debt is on a fixed rate. Trading at SGD 0.905, it is slightly above the NAV of SGD 0.904. The only gripe we had would be a lowering of income from the Australian properties due to the strengthening of SGD against the Australian dollar, but going forward these may be compensated with higher income from the three Singapore properties.


REIT #3: Frasers Logistics & Commercial Trust


Unlike the previous two, Frasers Logistics & Commercial Trust (FLCT) is made up of 99 logistics and 8 commercial properties spread across Australia, Singapore, Germany, the United Kingdom and the Netherlands. FLCT’s logistics and industrial/commercial ratio by portfolio value is around 68/32, and the logistics and industrial component enjoyed a 100% occupancy rate, with the commercial side at 90.6%, bringing to the average across the REIT at 96.2%5.


The main advantage of logistics and industrial sectors is that work from home does not really work since the goods and/or processes are to be housed in a physical property. The resumption of the global supply chain after the COVID-19 slowdown bode well for FLCT, too. The occupancy rate for the commercial portion, however, especially the United Kingdom properties, were not faring well (due to the work from home phenomenon). This is one point which I would revisit in the future, as well as their net property income which declined due to the strong SGD against the countries’ currencies where the properties are located.


At a gearing of 28.6% (lower than Paragon’s), with 75.4% debt at fixed rates, a high interest coverage ratio of 8x, and trading at 92% of its NAV (NAV of SGD 1.276 vs current market price of SGD 1.17), FLCT would be in our watchlist.


Disclaimer


Disclosure


The Bedokian is vested in all the abovementioned REITs.


1 – iREIT S-REIT Leaders Index SGD. SGX. https://www.sgx.com/indices/products/sreitlsp (accessed 20 Aug 2023).


2 – Frasers Centrepoint Trust Investor Presentation. May 2023. https://fct.frasersproperty.com/newsroom/20230509_073050_J69U_2IOJH8M54D407LB0.1.pdf (accessed 20 Aug 2023)


3 – Frasers Centrepoint Trust Annual Report 2022, p5 & p38. https://fct.frasersproperty.com/misc/ar2022.pdf(accessed 20 Aug 2023)


4 – Paragon REIT 1H FY2023 Financial Results. 7 Aug 2023. https://paragonreit.listedcompany.com/newsroom/20230807_193701_SK6U_C6Z3UOZ9XDMFOJO8.3.pdf(accessed 20 Aug 2023)


5 – Frasers Logistics & Commercial Trust 3QFY23 Business Update. 1 Aug 2023. https://flct.frasersproperty.com/newsroom/20230801_182514_BUOU_JZOH13NA5MBT4DKV.1.pdf (accessed 20 Aug 2023)


6 – Frasers Logistics & Commercial Trust 1HFY23 Results Presentation, p7. 4 May 2023. https://flct.frasersproperty.com/newsroom/20230504_070810_BUOU_BDL2BIU72TTDX75W.3.pdf (accessed 20 Aug 2023)


Saturday, August 12, 2023

Apple Is Down…Buy More?

The recent earnings report for Apple did not bode well for its share price; from its recent highs at the beginning of August of USD 196-ish, it went down to USD 177-ish at the close of the market on Friday, that was almost a 9.7% drop.

Let us find out from the Apple press release for the summary of their 2023 third quarter results1:

  • Quarterly revenue of USD 81.8 billion (bn), down 1% year-on-year (YoY).=
  • Quarterly earnings per diluted share of USD 1.26, up 5% YoY.
  • Generated operating cashflow of USD 26 bn.

Consolidated Financial Statements


If one wants to pinpoint the big fall, the consolidated financial statements attached in the same page as the press release may provide some insights. Under the statement of operations (or revenue statement), the quarterly YoY results for the main Apple hardware (iPhone, iPad and Mac) were around -5.4% across, with the nine-month YoY down about -6.2%. The category under Wearables, Home and Accessories posted a mixed result of around +2.5% and -3.4% for the three and nine-month YoY, respectively. These numbers, to a layman, could possibly mean a downtrend, at least short term wise.


However, the last category that carried the quarterly revenue reduction of up till -1%, was Services. Quarterly and nine-month YoY, it increased by +8.2% and +6.7%, respectively. Looking broadly over the long term, since the first quarter of 2013 right till the most recent, it had grown close to +475%2. And stating the obvious, it is the second highest revenue segment right after iPhone.


For growth counters like Apple, one of my guidelines is to see the amount of gearing either consistent or reducing at least for the past three years. Overall, since 2020, Apple’s total liabilities were increasing3, but it is fine with me as they were within my limits of “consistency”. Under the balance sheet, the total liabilities between September 2022 and July 2023 have reduced, and that is acceptable to me, at first glance. Moving on to cash flow, though undulating, it has been positive for at least the past three years4, another guideline of mine for growth counters.


So…Buy More?


I had mentioned in my post here that Apple would be relevant for at least another decade (discounting that the post was written back in 2020, maybe now for another seven years more? *chuckle*). Considering the financial strength, the large user base (2 billion active installed devices as of February this year5) and the all-encompassing ecosystem of Apple, the recent drop represented an opportunity to average down.


The next glaring question would be: at what price? Going by my 10-30 metrics6, using the period of one year between 1 August 2022 and 31 July 2023, the entry price would be around USD 161 ([196.45 + 161.51]/2 * 0.9), but instead I had nibbled at USD 184.50 on 4 Aug 2023 and then USD 177.50 on 11 Aug 2023, which I saw myself jumping the gun a bit. If it did not go down to USD 161 and went up instead, well, consider me lucky getting some. If it does go to USD 161, I would employ a much larger capital in entering. But, if you ask me what the bottom price will be before it goes up, I would also love to know the answer, too.


As the adage goes about prices, low can still go lower. Going by past statistics and future probabilities (my so-called guesstimate), unless a very major event happens (yes, I am thinking of an alien invasion), the trajectory of Apple would still be up. Not up in an astronomical sense like its early days, but it is still up, gradually.


And yes, dividends, Apple has been slowly increasing its dividends since it reinstated its dividend payment in 20137.


In conclusion, I will still declare that Apple is relevant, for another decade at least. Looking at the rising revenue of Services, the installed user base, and the Apple ecosystem…you get the drift.


Anecdotal Story


During our recent trip to Tokyo, Japan, from our observations of passengers in the subways and patrons in cafes and restaurants, the prevalent mobile phone brand is…Apple. During our flight on board Japan Airlines, most cabin crew were wearing Apple Watches (maybe as part of their work communications? *shrug*). It was glad to see many iPhone and Apple Watch users around (and contributing to our dividends). However, based on statistics, Apple held a roughly 49% share of the Japanese smartphone market in unit terms in 20228, so it is not really a majority as seen. From here, a lesson learnt is that we can combine statistics and observations as part of our fundamental analysis, and draw our own conclusions.


Disclaimer


Disclosure


The Bedokian is vested in Apple, and iPhone's rival mobile OS Android’s originator, Alphabet.


1 – Apple reports third quarter results. Apple. 3 Aug 2023. https://www.apple.com/newsroom/2023/08/apple-reports-third-quarter-results/ (accessed 12 Aug 2023)


2 – Laricchia, Federica. Revenue of Apple from services segment 2013-2023. Statista. 7 Aug 2023. https://www.statista.com/statistics/250918/apples-revenue-from-itunes-software-and-services/#:~:text=Revenue%20of%20Apple%20from%20services%20segment%202013%2D2023&text=In%20the%20third%20quarter%20of,%2C%20Apple%20Pay%2C%20and%20licensing. (accessed 12 Aug 2023)


3 – Apple Total Liabilities 2010-2013. Macrotrends. https://www.macrotrends.net/stocks/charts/AAPL/apple/total-liabilities (accessed 12 Aug 2023)


4 – Apple Inc (AAPL). Ycharts. https://ycharts.com/companies/AAPL/free_cash_flow (accessed 12 Aug 2023) 


5 – Shakir, Umar. Apple surpasses 2 billion active devices. The Verge. 3 Feb 2023. https://www.theverge.com/2023/2/2/23583501/apple-iphone-ipad-active-2-billion-devices-q1-2023 (accessed 12 Aug 2023)


6 – The Bedokian Portfolio (2nd Ed) p131-133.


7 – AAPL Dividend History. Nasdaq. https://www.nasdaq.com/market-activity/stocks/aapl/dividend-history(accessed 12 Aug 2023)


8 – Kaur, Dashveenjit. Four decades and billions of dollars in sales later, what’s next for Apple in Japan? Techwire Asia. 9 Aug 2023. https://techwireasia.com/2023/08/apple-remains-strong-in-japan/ (accessed 12 Aug 2023)


Monday, August 7, 2023

When Guideline Becomes Dogma

A relative of mine had an interesting quirk with regards to his type of carb intake for lunch and dinner, which goes like this: if I had rice for lunch, I would have noodles for dinner, and vice versa. At first look, it is a simple guideline to live by, until one day when we went for an overseas trip, and that was when we realised the guideline was more than that.

Long story short, he had noodles for lunch, hence when dinner time came, the location at where we were happened to be dominated by noodle shops. My relative insisted on having a rice meal for dinner, but we could not find any, at least at our immediate location. After walking for a couple of streets, we chanced upon a place selling baked rice and he finally ate at it, after a round of raving and ranting of not able to find a rice outlet.


What I had initially thought was a simple guideline turned out to be my relative’s dogma, i.e., “I cannot have two rice/noodle meals a day! I need to stick to my arrangement!”. Although this could be a frustrative experience for all parties concerned, such things are commonplace in our everyday lives. I believe you would have encountered situations of your family members/friends/acquaintances/colleagues of preferring, very strongly, a certain item/course of action/decision making basis, even though it might seem trivial at first glance, and there is not really much loss or opportunity cost in foregoing that preference.


It is hard to blame those who are insistent on these so-called trivialities. Everyone is born different, and this includes our personalities and characteristics, from which our attitudes to and perceptions of the world are dissimilar. While I acknowledge and agree on this, it is equally important that the person admits that he/she possesses these traits in them. Once these are admitted, then half the battle is won in recognising his/her own strengths and (especially) weaknesses.


A Contradicting World


Humans are adaptive creatures, so to speak, else we would not have been progressing this far in evolution and our existence on this planet. Being adaptive also meant that we are also flexible by nature. Yet, nestled among this adaption and flexibility are countless instances of adherence to doctrines which may not make sense. This is the contradicting world that we are living in.


However, we still need to have doctrines, and be adaptive and flexible at the same time. It is a fine balance between these two extremes. Too much flexibility would result in being frivolous, while too many doctrines would make one labelled as dogmatic. Again, how much balance is dependent on the very core of an individual, i.e., the personality and character.


Application On Investment


Applying the above to the realm of investment, it is a given that each one of us will have different investment philosophies, methodologies, styles and portfolios. Hence, in my blog posts and eBook, I have guidelines in place for certain issues, e.g., selection of securities and the make-up of portfolio, as I accept and encourage these differences. However, simultaneously I also promote a dogmatic approach on aspects like diversification and rebalancing, because of my conviction in them. This is a case where I am balancing the adaptive/flexibility and doctrinal spectrum in my investment philosophy. Sounds ironic, but we are humans after all.