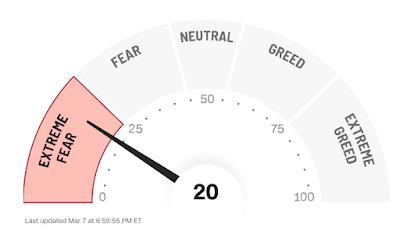
On 2 Apr 2025, dubbed as “Liberation Day” by the current U.S. administration, a “show-and-tell” by the incumbent president on the imposition of reciprocal tariff rates on every possible nation and territory in the world, had wiped off at least USD 2.4 trillion worth of market cap from Wall Street1.
Apple plunged close to 15.8% over two days, and Amazon’s price down by around 12.6% over the same period, due to their supply chains intertwining closely with China, one of the main targets of the tariff drive. Across the global markets, indices and prices were down in various magnitudes over the uncertainties of the impact that the tariffs would bring.
In this post, I would not delve into the intricacies and implications of the tariff rates, and the main macroeconomic reasons why the U.S. is doing this, as these are factors way beyond our control, I will instead focus from the investor side of things.
Same, But Different, But Still Same
For those who had invested at least for the past six years, this plunging market scenario is like the one that was encountered during the COVID-19 crisis back in Mar 2020. Some may argue that the context of both situations is different, i.e., one was a pandemic where no one could predict when it would end, whereas the other is a deliberate economic event where somebody may know when it could end, these periods marked good moments to enter counters that one may have been waiting for, and/or to average down current holdings due to their relatively cheaper valuations.
And it seems that a lot of investors are learning this “buy the dip”; the day after Liberation Day on 3 Apr, retail and individual investors made USD 4.7 billion worth of net equity purchases (difference between bought and sold), the highest in 10 years2. Yes, I am one of them.
Good Companies Tend To Be Resilient
While every equity security is screaming “cheap cheap” now, not all are equal; some may turn out well and become multi-baggers in the years to come, but there are a few whose prices could remain at a low level for longer periods. This is where the concept of company fundamentals come into play, and those with wide healthy financial numbers like good free cash flows, low gearing, etc., and strong moats like reliable customer bases and near monopolistic products/services, etc. would tend to pull through.
Fundamental analysis is needed to see if the companies are resilient. For one’s current holdings, a periodic review may be sufficient, while a full one is necessary if prospecting for new counters to invest in.
We Cannot Tell The Future
Will the tariffs be reduced? How much lower will the S&P 500 go to? What would be the bottom price for Apple?
My only answer to them is four words: I do not know. As oft mentioned by me, predictions, especially the correct outcome at the right moment, are short of impossible to state. In terms of the timing to go into the market, one can use indicators (valuations, price signals, etc.) as a gauge of whether to buy into the company/index exchange traded funds (ETFs). If one is on the path of passive investing with periodic rebalancing, and/or following a disciplined periodic approach of buying into the securities, then just continue with it.
The last best time to invest in a dip was five years ago. The second-best time is (probably) now.
Stay calm and invested.
Disclosure
The Bedokian is vested in Apple and the S&P 500 via SPY ETF.
1 – Wynne, Alan. Lessons from “Liberation Day”: A guide to tariffs. J.P. Morgan Wealth Management. 4 Apr 2025. https://www.jpmorgan.com/insights/markets/top-market-takeaways/tmt-lessons-from-liberation-day-a-guide-to-tariffs (accessed 5 Apr 2025)
2 – Gottsegen, Gordon. Individual investors made a record $4.7 billion in stock purchases Thursday as new tariffs pummeled markets. Marketwatch. 4 Apr 2025. https://www.marketwatch.com/story/individual-investors-net-bought-a-record-4-7-billion-worth-of-stocks-on-thursday-as-new-tariffs-pummeled-markets-a82a4a8c (accessed 5 Apr 2025)


