Showing posts with label Chapter 4 - Bonds. Show all posts

Saturday, August 2, 2025

Astrea 9 Private Equity Bonds


Azalea Asset Management, which is indirectly owned by Temasek Holdings, is issuing the Astrea 9 private equity (PE) bond on 8 Aug 2025. This bond will be listed on the Singapore Exchange, joining the earlier issued Astrea VI, Astrea 7 and Astrea 8 bonds.


There are three bond classes in the Astrea 9 series, with two classes (A-1 and A-2) available for retail investors. Figure 1 provides a brief of the two.


Fig.1: Information of the Astrea 9 A-1 and A-2 bond classes. Screenshot from Azalea website.


The Astrea 9 Transaction Portfolio, from which it derives the cash flow for the bonds, is made up of 40 PE funds managed by 31 General Partners and across 1,086 investee companies. These investee companies are diversified across:

  • Sectors (31% in information technology, 21% in industrials, 15% in health care, and the rest across other sectors such as financials, communication services, etc.)
  • Geographically (66% in the United States, 26% in Europe and 8% in Asia)
  • Fund Age (between three and eight years, with the five-year and six-year making up 52%)


As seen in Figure 2, A-1 and A-2 bondholders are relatively high up in the receipt of distributions (Clause 5). 


Fig. 2: Astrea 9 cash flow and priority of payments. Screenshot from Azalea website.


The Rates

The annual interest rates (or coupon rates) for A-1 and A-2 are 3.4% and 5.7% respectively. Like the previous Astrea bonds, the rate for US$ denominated bonds are higher to compensate for the forex risk vis-à-vis against the S$. With the US$ depreciating against S$ by around 5.8% for the past five years, and we do not know how the US$-S$ forex rate would be, it is usually prudent to stick to local currency for fixed income instruments.


Perhaps the major consideration of investing in corporate bonds would be comparing with the (relatively) risk-free rate of Singapore government bond yields for the same duration. With the Astrea 9 bonds having the earliest callable date in five years and the maturity date 15 years later, and using the current Singapore government 5-year and 15-year bond yields at 1.8%1 and 2.21%2 respectively, the 5-year risk premium is 1.6% (3.4 – 1.8) while the 15-year risk premium is 2.19% (3.4 + 1 (step-up) – 2.21).


The Bedokian’s Take

The Bedokian Portfolio’s bond selection entails the bond to be at least of investment grade and five years to maturity3, to which both A-1 and A-2 met the mark. 


The low risk premium may be slightly uncomfortable for some conservative investors, since there is a very remote chance of the bond defaulting on the coupon payments and principal. So far, the retail tranches of past and current Astrea bonds (IV, V, VI, 7 and 8) have/had paid regular coupons on time, with no impairment of the principal.


With Singapore Savings Bond and bank fixed deposit rates going down, many investors may go for this as the next deemed “fixed deposit”, though I would caution it is still a listed instrument subjected to price and market volatility.


The offer period for the bond is from now till 1200 hrs, 6 Aug 2025.


Disclaimer


Reference

Astrea 9 Bond Prospectus - https://www.azalea.com.sg/sites/default/files/2025-08/astrea-9-pte-ltd-prospectus-30-july-2025.pdf 


1 – Singapore 5 Year Bond Yield. Trading Economics. 1 Aug 2025. https://tradingeconomics.com/singapore/5-year-bond-yield

2 – Singapore 15 Year Bond Yield. Trading Economics. 1 Aug 2025. https://tradingeconomics.com/singapore/15-year-bond-yield

3 – The Bedokian Portfolio (2nd ed), p108.


Saturday, March 22, 2025

Being Opportunistic In the Past Weeks

Uncertainties caused by the threat of tariffs (implied or about to be implemented), and a slew of other minor reasons, had spooked the markets somewhat, with the S&P 500 index down more than 4% year-to-date. A down market is the time to look for bargains, and ample opportunities to buy in counters at relatively less expensive prices and/or to average down on securities that one may have already owned.


Picture generated by Meta AI

Yes, this smack of the characteristic called market timing, which is usually frowned upon as the future price movement is a big unknown. However, any price is a good price if the investor felt the fundamentals and/or valuations had hit the right spot.


To summarise, since February, we had added the following five assets into our Portfolio Multiverse:


  • Alphabet (Bedokian Portfolio)
  • Nvidia (Bedokian Portfolio)
  • OCBC (CPF Portfolio)
  • NikkoAM-StraitsTrading Asia ex Japan REIT ETF (Bedokian Portfolio)
  • Cryptocurrencies Bitcoin and Ether (Trading Portfolio)


Frankly, more counters were planned to be added, such as Frasers Centrepoint Trust, Frasers Logistics & Commercial Trust, and some bond ETFs (e.g., ABF Singapore Bond Index Fund, Nikko AM SGD Investment Grade Corporate Bond ETF, etc.) that we had in our holdings. However, these counters had seen a rise from around mid-March that, in my opinion, was possibly due to capital shift and asset class/regional rotation into Singapore assets, among other things.


There are always buying opportunities abound in the markets, depending on the economic situation, asset classes and market sentiments.


Disclosure

The Bedokian is vested in the mentioned counters/securities/assets in this blog post.


Disclaimer


Sunday, January 26, 2025

The Rationale Of The Asset Classes: The Bedokian Portfolio 300th Post Special

I was asked a few times on the asset classes in the Bedokian Portfolio, specifically on why I had included them. In fact, I had mentioned the rationale in my eBook, which I will reproduce here1:


“Both equities and REITs provide dividends, with the former having higher potential capital growth; Bonds give a stabilising effect when equities and/or REITs are weakening, while still earning coupon payouts; Commodities, though it is a non-yielding asset class, give the necessary softening of the overall portfolio from volatility; Cash, though acting as a pool of liquidity, could still be an interest-bearing instrument.”


Picture generated by Meta AI


For the past decade, we had seen the “Sunday” and “Monday” moments for each of the asset classes; equities lead the charge most of the time, save for the COVID and accelerating interest rate periods in 2020 and 2023-2024 respectively; REITs were the darlings for dividend investors, until COVID and high interest rates pressed them down; bonds were riding high during COVID as a flight to safety; commodities in general were muted until the post-COVID geopolitical uncertainties kicked in; cash languished until high rates spurred interest in treasury bills and fixed deposits.


The basis for all these is due to the different behaviours of each asset class under different economic conditions; in other words, they have different correlations with one another. If you had read the previous paragraph, not all of them had a bad time together, nor a good time together, too. In this way, our Bedokian Portfolios do not suffer the high swings of down and up experienced by an individual asset class, because if one or some asset classes plummet, the others would somehow “hard carry” up for the team.


Thus, the above example serves as an important lesson on diversification; the act of not putting all of one’s eggs into a basket. Though the gains may not be as much as placing all into one asset class (especially equities), but at least the risks and losses can be mitigated via diversifying. 


1 – The Bedokian Portfolio (2nd Ed), p71


Saturday, October 5, 2024

Macroeconomic Lessons To Learn From The Past Two Years

Due in part to the spike in demand and limited supply of products in the aftermath of COVID-19, and a host of other reasons such as geopolitical ones (e.g. Russian-Ukrainian conflict) and the long period of low interest rates which flushed the economy with cheap-loan capital, caused inflation to rear its ugly head. The subsequent accelerated rise of interest rates that was never seen before since the mid-2000s had brought an unprecedented economic environment in which most younger investors had not experienced before.

The past two years or so had provided useful insights and learning opportunities for us investors, and that is attributed to one macroeconomic policy: interest rates. What I would be sharing in the next few paragraphs are theoretical knowledge found in economics and finance textbooks, and most of the occurrences did happen, thus giving a sort of “classic textbook examples”.


Picture generated by Meta AI


Inflation And Interest Rates

When inflation is perceived to be happening, countries whose central banks can control interest rates (like the United States or U.S.) would raise them to bring inflation down. The rationale behind this is that when interest rates go up, the cost of borrowing would go up, and this slows down capital investments by companies as loans are getting expensive. Simultaneously, for consumers, higher rates meant higher returns from safe instruments such as short-term treasuries and bank deposits, which in turn encourages saving and less spending. All these cool down the economy and lower inflation.


For Singapore, instead of interest rates, our central bank (Monetary Authority of Singapore, MAS) used the exchange rate policy to manage the monetary policy. However, it is noted that our interest rates are very closely correlated with that of the U.S.’ in terms of direction and movement (see here and here for further explanations).


Effects On Asset Classes

Now that you got the gist from the previous paragraph, you could roughly tell what are the asset classes affected by high interest rates. Positively, as mentioned, are cash (in banks and money market funds) and short-term treasuries (less than two years). Negative ones include real estate investment trusts, or REITs (being leveraged investment vehicles, higher rates affect distributions to REIT unitholders), bonds (interest rates and bonds are inversely correlated) and lastly, commodities (which do not provide yield). For equities, though the cost of borrowing may affect the growth of companies, for some sectors such as finance (banks) and technology, as well as cash-rich companies, enjoyed some boom time.


True enough to a certain extent, we saw that REITs were hammered, a lot of people flocking to erstwhile boring treasury bills and fixed deposits, and gold was somehow muted throughout 2022 and 2023, to name a few.


Everything Is A Cycle

Good times do not last, and so are bad ones. All markets and economies go through a cycle, from bust to boom to bust to boom again. Now that the U.S. Federal Reserve had brought down rates, with more planned ahead, we could see treasury bill yields going down, REITs roaring back up, gold surging ahead, etc. The undulating nature of the market and economy, and the behaviours of the asset classes during these cycles, proved the importance of having a diversified portfolio with periodic rebalancing. With diversification and rebalancing, your investment portfolio can be protected from huge downswings and capital losses can be lessened. 


Ceteris Paribus

Last but not least, all economic scenarios and assumptions are accompanied by the term ceteris paribus, which translated from Latin is “all things being equal” (read here for more information). As we know, the economy is like a machine with many moving parts, working and affecting one another at the same time (read here for the economic machine analogy). Thus, even though we can observe “textbook examples” happening, sometimes it may not go according to theory, or even so, it might be other factors at play to give it a “textbook answer”.


Still, in my view, it is better to have some basic economic and financial knowledge to get a grasp of the complicated, yet simple, world of investing.


Monday, September 16, 2024

25 Or 50 Basis Points?

The investing and trading world will be waiting with bated breath this coming Wednesday and Thursday (17 and 18 September); the Federal Open Market Committee, better known as the Fed, is expecting to announce an interest rate cut for the first time in around three years. After the intent was made known by the Fed back in August, you could observe equities, real estate investment trusts (REITs) and even gold were rising in anticipation.


Picture generated by Meta AI

While the consensus among economists, analysts and retail investors were looking at a highly probable 25 basis points cut, there were some quarters that speculated a higher rate cut at 50 basis points. The reason for the latter is mainly on the viewpoint that the prolonged high interest rates are hurting the market more than it should, and this opinion is gaining traction. As of 13 September, the CME FedWatch had placed an equal probability (i.e., 50%) for a 25 and 50 basis point cuts; just the week before, the 50-basis point cut was given only a 30% chance1.


Potential Reaction Of Markets 

Interest rates play a huge part in the performances of the various asset classes; equities, REITs, long term and corporate bonds, and gold are on the uptrend, while short term treasuries and cash are seeing a downside. From my observations and guesstimates, my conclusion is that the markets are currently pricing in a 25-basis points reduction. However, if 50 basis points is announced, the market volatility would be higher, whether is it upwards or downwards is depending on which asset class, sector / industry and companies that you are looking at. 


This means REITs may rise further, gold may yet reach another all-time high, banks may feel a slight downward pressure due to the deemed lower net interest income, the USD/SGD exchange rate may go down to the level not seen since late 2014, etc. Notice the word “may” used, because we do not really know how the markets will react, hence the word “potential” for this section heading.


For this round, I may adopt the following actions (not exhaustive):

  • Change more USD and/or buy more USD denominated counters.
  • Average up fundamentally sound equities and REITs that do not rise much vis-à-vis the general market rise. 
  • Average up corporate bonds.
  • Buy into banks if price weakness is shown


Whatever the interest rates, and macroeconomic conditions, good or bad, there is always an opportunity to invest in the markets.


Disclaimer


1 – FedWatch. CME Group. 13 Sep 2024. https://www.cmegroup.com/markets/interest-rates/cme-fedwatch-tool.html (accessed 15 Sep 2024).

Monday, April 1, 2024

On The Degrees Of Diversification

Apart from commodities and cash, the Bedokian way of diversification, if it is to be done, is from top to bottom: asset class, region/country and then to sector/industry. Some of you may be wondering, why the further diversification below asset class has to be in that order.


Region/Country

Generally, an asset class in a region or country will perform differently from another. For instance, the table below shows the stock market (i.e., mainly of equities asset class) returns of various countries between 2009 and 2023 (Figure 1):

Fig.1: International Stock Market Returns, 2009 to 2023. Source: Novel Investor (www.novelinvestor.com). Click to enlarge.

Looking at some years, we had the extreme case of 2015 where the Danish index gained 24.4% while the Canadian index dropped 23.6%. In the year 2018 which all indices were negative, the Finnish one was only down by 2.2% while the Austrian one suffered -27.1%.

The same goes for real estate investment trusts (REITs). According to data from NAREIT (Figure 2), for the regions of North America, developed Asia, developed Europe and emerging real estate showed different returns for the years 2021, 2022 and 2023.

Fig.2: Excerpted from REIT Performance 2023 Q3, with 2021, 2022 and 2023 YTD shown in last three columns. Source: NAREIT Quarterly REIT Performance Data (www.reit.com). Click to enlarge.

Bonds wise, using another matrix of different regions/countries (Figure 3), the differing results were like that of equities’ in Figure 1:

Fig.3: Fixed Income Country Returns, USD Hedged, 2009 to 2022. Source: Alliance Bernstein and Bloomberg (www.alliancebernstein.com). Click to enlarge.

As what the heading said in Figure 3, no country wins all the time.


Sector/Industry

Why and how each region/country’s asset classes behave differently is very much impacted by the next layer of diversification, that is sector/industry. The proportions of the sectors/industries are different in the economies of various regions and countries, and this in turn drives the outcome of returns of that area. Socioeconomic, geopolitical, and regulatory factors also play a part in the overall scheme of things. Thus, Country A’s banking sector may thrive more than Country B’s; Country C’s property market is worse off than Country D’s, and Country E’s government bonds are higher yielding than Country F’s due to the former’s lower ratings.

Putting it to real life examples, Figure 4 shows the comparison between the United States (US) and China healthcare sector, with convergences and divergences throughout a 10-year period. Another reality is on REITs where US office property sector is facing a crisis whilst Singapore’s are having a better outlook, so far.

Fig.4: 10-Year Comparison between US Health Care Select Sector Index and S&P China A 300 Health Care (Sector) Index (USD). Source: S&P Global (www.spglobal.com). Click to enlarge.


Exception: Thematic Investing

The main exception to the above diversification order is thematic investing. Blending both region/country and sector/industry, exchange traded funds (ETFs) that use thematic investing tend to bundle in companies from sectors/industries that are part of the theme, regardless of their nation of origin. Using an ETF which we are vested, the iShares Global Clean Energy ETF (ICLN)1, it contains companies from the information technology, utilities, industrials, etc. sectors/industries from countries such as the US, China, Denmark, India, etc. 


Disclaimer


Disclosure

The Bedokian is vested in ICLN.


1 – iShares Global Clean Energy ETF. iShares. https://www.ishares.com/us/products/239738/ishares-global-clean-energy-etf (accessed 31 Mar 2024)


Saturday, November 25, 2023

Going All-In Into Treasury Bills And Deposits?

With interest rates now at an all-time high since around 16 years ago, short term treasuries and bank deposits are providing a much safer and better deal in providing more bang for the buck (from a risk premium point of view). It is basically common sense; why would I want to plonk my monies in an investment with possible capital loss for maybe an additional 1-2% yield when I could put it in an almost-capital guaranteed place at an almost-guaranteed return?

Yet, investors (including myself) are going for the former, scrolling through numerous screeners, scrutinizing the ratios and financial numbers, getting knowledge on the company’s/sector’s/industry’s goings-on, and understanding the macroeconomics of the time, etc. I must confess it is hard work, and all these could be dealt away with by just applying the latest treasury bill and/or going down to the bank/financial institution that offered the best rates.


You can still do that, but for myself I would not switch 100% of my capital to them. As the adage goes, “Good times do not last forever”. We cannot expect that interest rates would stay high, and just like other forms of investments, they will go down eventually. This is because markets and economies go through a cycle, and other instruments would provide a better bang for the buck than treasuries and deposits. We need not look further than just two years ago when little people paid attention to them due to the low interest rate environment.


This is where we need to capitalise on the (deemed) only free lunch in the investing world, which is diversification. By diversifying, you can capture the prevailing highest return offered by an asset class / region / country / sector / industry / company on part of your investment portfolio, while at the same time protecting it from extreme drawdowns suffered by other asset classes / regions…etc.


Quoting the second part of the adage mentioned above, that is “Bad times do not last forever, too”, brings us to the diversification-related property of rebalancing. Depending on the preferred make-up, or asset allocation, of your investment portfolio, if an asset class begins to grow/decline beyond the set allocated level, you can either start selling/buying counters from that said asset class, or inject funds to buy up others, or both, to bring balance back to the portfolio.


Whilst some critics may say the method above reduces overall returns as compared to having a concentrated portfolio, which is correct, the main aim is to try to reduce as much risk as possible. Sure enough, we have had heard of success stories of investors/traders going all into one counter and reaped exorbitant profits, but what if the call was wrong? We cannot predict how the markets and economies turn out, and investing gurus and fund managers are not correct all the time, same as us retail investors. Thus diversification, rebalancing and asset allocation are a better defence against volatility and outright 100% capital loss (save for alien invasions and nuclear winters).


A final word for dividend investors: high interest rates are not favourable for equities and REITs due to high costs of leverage, and this brings a bargain for erstwhile healthy counters which were depressed overall by the situation. As we know current yield = dividend / current price, if the leverage is low, cash flow is strong and there are still profits, it is a good consideration to look at it further and swoop in if it is worth.


Wednesday, December 21, 2022

Mad About Fixed Deposits, SSBs And T-Bills…How About The Others?

I believe now it is super obvious that a lot of investors are mad on fixed deposits, Singapore Savings Bonds (SSBs) and treasury bills (T-bills). There will always be a moment where these things are mentioned, from informal conversations to family groups on chat apps. This is akin to a mania, which is usually associated as something bad. But unlike manias of the past (tulips) and present (meme stocks), this is a good one, for these financial instruments and their returns are reliable and almost guaranteed.

While people are clamoring for these products, other asset classes such as equities and REITs are being forgotten, and rightfully so, since they are currently experiencing a volatile period in a southerly direction. Though it may sound counter-intuitive at this moment, I believe it is the right time to look at them now. As per the principles of diversification (and rebalancing), we should not be overweight on a particular asset class.


While it is very tempting to capitalise on the high interest and coupon rates, we can consider capitalising on the equities and REITs fronts, too, since they are quite battered. With good selection criteria, for growth investors this means a potential capital gain; for dividend investors there might be a higher yield on cost at play; and for index investors the indices may go to yet another all-time high after recovery.


Cheers and Merry Christmas!


Monday, September 5, 2022

Bank Interest Rates: It’s Like Back In 2001

I recalled the time when I was flipping through a newspaper trying to find out the latest fixed deposit rates of the banks and finance companies. Yes, the internet back then was not so friendly in terms of having consolidated information within a click, so going for print media was the next best thing on seeing things in one page.

I was trying to park SGD 10K for about a year, as back then I did not know much about the stock market (and buying shares meant getting minimally 1,000 of them, which I could not afford, and through a phone call), interest rates was the main passive money making concept that I knew (and to think I had just graduated from an economics discipline).


The highest one-year fixed deposit rate then was about 3.25% from a finance company. This finance company had (and still has) a branch in Bedok, so I decided to walk around the vicinity to look for it (again, back then there was no smartphone for me to google the address on the spot). In the end, I went to another finance company instead (offering 3%) as I was lazy (and inherently cautious carrying SGD 10K worth of cash) to walk around further to look for the one that I had planned originally to go to (turns out that if I had persevered my journey to the next block, I would have had earned an extra 0.25%).


Interest rates were quite high then; I remembered mortgage loans were around 5% to 6%, and savings accounts were about 1.x% to 2%.


Also back in 2001, the United States (U.S.) federal funds rate was around 5.x%. Tracking the movements of both rates, it is obvious that our local interest rates and the U.S.’ were (and still are) positively correlated. Therefore, when news of the U.S. Federal Reserve planning for more rate hikes, expect our side to do the same, be it on fixed deposits, savings and mortgage rates.


Fast forward to now, we are now seeing bank fixed deposit interest rates going up into the regions (around 2.x% for a 12-month tenure) where it was unheard of for almost 15 years (I picked fixed deposit rates for a clean comparison as they are typically unencumbered with step-up and promotional rates, which are typical of savings accounts). And these rates are relatively comparable to the current offerings from treasury bills and Singapore Savings Bonds.


Having a 3% fixed deposit rate is unprecedented now, but remember, it was the norm back in 2001. Being in a near zero-interest-rate-period (ZIRP) for a long time, it is hard to blame new investors, most of whom entering the markets within the ZIRP, of not factoring in interest rates in the overall scheme of things. A diversified portfolio approach is still prudent in certain and uncertain times, and times of differing economic conditions, including interest rate movements.


Sunday, August 28, 2022

My Name Is Bond…

Never in the history of my investment experience that I had seen such mass enthusiasm on bonds. It is understandable as we are in a rising interest rate environment, which favours short-term treasury bills, and the fear of a coming real recession, which bode well for longer term bonds as a safe haven. Suddenly, what is seen as a boring financial instrument is now generating so much attention.

Here is an interesting trivia: Did you know that the global bond (or fixed income) market is larger than that of equities? In 2021, the global fixed income outstanding stood at United States Dollars (USD) 126.9 trillion while the global equity market cap was at USD 124.4 trillion1. Though by a narrow margin, this would likely be widened in 2022 when the equity market cap is facing a downward pressure.


Bonds usually fill in the role of the counterweight to equities, and these two would form the most basic of investment portfolios. The weightage of both varies, but the oft quoted one is the 60/40 equities/bond ratio, which is still used as the benchmark standard.


The reasons why bonds are added to a portfolio mix are due to its differing correlation with equities, and the traditional go-to asset class during bad market days. However, the correlation notion has been challenged as bonds do display high positiveness with equities at certain points in time. A rising interest rate setting is not good for bonds (especially longer-term ones) as it would lose their demand if the coupon rates were lower than that of the prevailing interest rates.


Regardless of the macro intricacies of bonds, correlation and rates, an investment portfolio should last at least 10 years (my minimum timeframe) or more, and we do see the usefulness of bonds in providing some sort of safety net and volatility dampener. The other way would be to diversify further with more asset classes, as what The Bedokian Portfolio added with real estate investment trusts (REITs), commodities (gold, silver and oil) and cash, to make the whole correlation thing more varied.


To end off this short post, do remember that the bonds that I had mentioned here are good quality bonds, i.e., issued with investment-grade credit ratings, typical of good government and corporate bonds.


1 – Kolchin, Katie, et al. 2022 Capital Markets Fact Book. SIFMA. July 2022. https://www.sifma.org/wp-content/uploads/2022/07/CM-Fact-Book-2022-SIFMA.pdf (accessed 28 Aug 2022)


Wednesday, August 10, 2022

Treasury Bills: What Are They?

The rise in interest rates in recent months has seen yet another rise in interest (pun intended) generated, based on what I have read online (yes, the Bedokian does scour the WWW for information) and offline amongst my friends, acquaintances and colleagues. First, there was (and still is) the hype over Singapore Savings Bonds, or SSBs (which I had written a piece here). The upcoming buzzword is “treasury bills”, or T-bills for short.

Introduction Of The T-Bill


In fixed income nomenclature, bills are debt instruments, issued by a government, whose duration is one year or less. Hence in layman speak, they are bonds with a very short term.


Due to this short-term nature, the coupon rate of a T-bill tends to be similar with the prevailing interest rate as at the time of the former’s issuance. With a tenure of one year or less, it is akin to a form of fixed deposit that you will find in banks. You could sell the T-bill on the open market before maturity, but it would be subject to market forces and you may profit or lose some amount, so it is recommended to hold it till maturity.


Under The Bedokian Portfolio’s classification, the T-bill belongs to the cash asset class due to its two main characteristics: the short duration and the positive correlation to prevalent interest rates, from which how cash derives its returns. Liquidity wise, it is easy to just sell it on the open market and get back the principal, though as mentioned in the previous paragraph there are market risks involved.


The Workings Of The T-Bill


Unlike other debt instruments, where the coupon is paid half yearly or annually, the T-bill’s coupon is paid upfront. T-bills are issued at a discount below par value, and the difference is the coupon/interest paid out. For example, I had applied for a one-year T-bill at the minimum bid of SGD 1,000, and after the closing of the application, the T-bill is issued at SGD 950, and I will get back the SGD 50. This SGD 50 is the coupon/interest for the T-bill, which the yield works out to be 5% (50/1000). When the T-bill matures, the full SGD 1,000 sum is returned.


For retail investors like you and me, Singapore T-bills can be applied using cash, Supplementary Retirement Scheme (SRS) account and Central Provident Fund (CPF) account through the three local banks: DBS, OCBC and UOB (note: you could sell your T-bills over the counter at either one of these three banks). Applications using cash and SRS can be done online or through the automated teller machines, while in-person applications are required at the bank where the CPF investment account is at.


Once you had settled on using cash, SRS or CPF, the next step is to bid (or auction) for the T-bills, which is a bit more technical as compared to applying for SSBs. There are two ways to bid for it, competitive or non-competitive. Competitive bidding is where you will input an annual yield number (in percentage and up to 2 decimal places) and that number signifies your lowest acceptable yield. In non-competitive bidding, you just accept whatever yield you are getting. From here, you can see that using a non-competitive bid can almost guarantee issuance, while a competitive bid depends on what yield number you put in; if your submitted number is higher than the result, you would not get the T-bill. If you are in the know and can roughly guesstimate the prevailing yield, then you may want to attempt a competitive bidding.


Unlike SSBs, where there is a consolidated limit of SGD 200,000 per individual, T-bills (and other Singapore government bonds) limits are much higher (at least SGD 1 million) for each issuance. Also, you can submit as many bids as you want, whether through non-competitive or a series of competitive bids with different yield numbers.


The Bedokian Getting The Feet Wet


We had recently applied for the 6-month T-bill (BS22115F closed on 4 Aug 2022) using cash and through UOB online banking (see Figure 1). One non-competitive bid and one competitive bid (bid at 2.8%) were submitted for SGD 1,000 each (see Figures 1.1 and 1.2 respectively):


Fig. 1


Fig. 1.1


Fig. 1.2
 

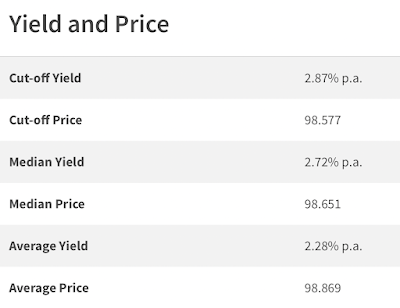
Here is an excerpt of the results of the T-bill BS22115F from the Monetary Authority of Singapore (MAS) website (Figure 2):


Fig. 2

There are many numbers, but just look at the first two rows will do: the cut-off yield is applicable to competitive bids, where if you submitted any number above that, the bid is out. The cut-off price is the eventual amount of the T-bill, which is 98.577 (remember the T-bill is issued below the par value of SGD 1,000). Multiply this number by 10 and your T-bill is worth SGD 985.77, and the amount of SGD 1,000 – SGD 985.77 = SGD 14.23 is the coupon/interest.


Both of our bids were successful, and we had 2 x SGD 14.23 refunded on 4 Aug 2022 (see Figure 3). This refund is also the T-bill coupon/interest amount.


Fig. 3

Since this is a cash application, the T-bills appeared in the Central Depository account on 10 Aug 2022 (Figure 4).


Fig. 4


Conclusion


Even if not for investment purposes, the T-Bills are another good alternative to store your cash which you foresee not using for at least the next six months to a year.


References:


https://www.mas.gov.sg/bonds-and-bills/Singapore-Government-T-bills-Information-for-Individuals

Monday, July 18, 2022

The Uniqueness Of The Singapore Savings Bond

The Singapore Savings Bond, or SSB, was introduced by the Singapore Government as a safe, long term and flexible means of investing. Unlike normal government bonds, in which a fixed coupon rate is paid at a prescribed pay date, the SSB rates steps up as each year goes by, thus it is more worthwhile to keep it long term. Also, the SSB is not subject to market volatility; once redeemed, you will get back the whole sum, plus any interest amount accrued.

It is this feature that led to me classifying the SSB as a form of cash-bond hybrid: cash in terms of depository mechanism, and bond if the cash is kept till the end, i.e., after 10 years. Though the redemption is not as instant as withdrawing cash from a savings account in a bank, the cash in the SSB could be withdrawn possibly in about slightly more than a week’s time, depending on which part of the month the redemption request was submitted.


Recently, I could see a lot of hype surrounding the SSB: from investment and non-investment social media chat groups that I am in; from a colleague with whom I had never discussed investing with before; and a relative of mine had suddenly popped me a question about it. This is naturally obvious as SSB are viewed as almost risk-free and the rates are moving up in the past months. The latter is mostly due to the rise of interest rates in the United States, which is positively correlated to our local interest rates, though this relationship is somewhat not so straightforward (and I had explained a bit on this here).


What’s the uniqueness, then, for the SSB? Well, I had already described three of the attributes in my above paragraphs. We shall have a look at them in detail below.


#1: Step-Up Annual Interest Rates


The first unique point about the SSB is the step-up interest rate structure, which is unheard of in other bonds. The rates are published right at the onset of the issuance, therefore you know how much you would be getting from the interest every year.


#2: Not Subject To Market Volatility


The SSB is traded between yourself and the issuer, the Monetary Authority of Singapore (MAS), and no one else. This means it is not subjected to the volatile forces of the market, where most of the risks are. As we know, bonds are susceptible especially to market (i.e., loss of principal/capital) and rate risks (i.e., bonds with higher coupon/interest rates are favoured over those with lower ones, causing the latter to lose their demand). 


The SSB does not have these two big risks: no capital loss (you will get back everything, minus the SGD 2.00 transaction fee if redeemed before maturity) and if the current rates are higher than the one you are holding, you could redeem it and apply again (though fresh funds may be needed as there is insufficient turnaround time to use the redeemed amount to buy the current SSB).


#3: It Is A Cash-Bond Hybrid


I came up with the conclusion of the SSB being a cash-bond hybrid (from The Bedokian Portfolio’s perspective) is due to the following reasons:


Cash – For The Bedokian Portfolio, cash served as a pool where injections, dividends, interest payments and returns are contained, and acts as a starting point to deploy to other asset classes. It is important that cash should not lose its value, which was why I advocated placing them at least in the safety of banks. SSB’s ability to preserve principal (as described in #2) qualifies it suitable to hold cash.


Cash as an asset class is dependent on interest rates for returns. For the SSB, its interest rates are based on the reference yield of the various tenures (1, 2, 5 and 10 years) of the Singapore Government Securities (SGS, commonly known as Singapore government bonds), which, through a series of connections, are positively correlated to U.S. interest rates.


Bonds – Unlike typical means of cash holdings where there is no expiry date, the SSB has a tenure of 10 years. Thus, if held for the full term, the SSB’s characteristic is akin to a bond asset class.


Conclusion


The SSB is a good investment vehicle to include in your portfolio, given the good credit ratings of SGS. The caveat is that an individual is only allowed to have a maximum of SGD 200,000 in SSB, so if you are adopting a 60/40 equities/bond portfolio and the size is above SGD 500,000, you would have to look for alternatives like other SGS, corporate bonds or bond exchange traded funds.


Disclaimer:


The Bedokian is vested in SSB.